Rendering GPX tracks in React
GPX files are used to track a variety of sports and activities. When we take a look under the hood, we see that they use a simple XML based schema. Such files can easily be rendered in a React application with the help of libraries like Leaflet.

Intro
If you are into running, hiking or biking then chances are that you are tracking your sessions with either a special device like a watch or your smartphone. Typically we are recording our location, time and additional data like heart rate and altitude in order to analyse our routes, speed and training progress.
This information is typically stored in .gpx files.
In this article we will see how we can take such a file and display our route on a map in React.
GPX Files
Have you ever opened a GPX file in an editor? You will be pleasantly surprised by what you'll see! These files use a very simple, XML-based format and you would almost immediately understand the schema used in there.
Let's have a look at an example:
<?xml version="1.0" encoding="UTF-8" standalone="no" ?>

<gpx xmlns="http://www.topografix.com/GPX/1/1" xmlns:gpxx="http://www.garmin.com/xmlschemas/GpxExtensions/v3" xmlns:gpxtpx="http://www.garmin.com/xmlschemas/TrackPointExtension/v1" creator="Oregon 400t" version="1.1" xmlns:xsi="http://www.w3.org/2001/XMLSchema-instance" xsi:schemaLocation="http://www.topografix.com/GPX/1/1 http://www.topografix.com/GPX/1/1/gpx.xsd http://www.garmin.com/xmlschemas/GpxExtensions/v3 http://www.garmin.com/xmlschemas/GpxExtensionsv3.xsd http://www.garmin.com/xmlschemas/TrackPointExtension/v1 http://www.garmin.com/xmlschemas/TrackPointExtensionv1.xsd">
  <metadata>
    <link href="http://www.garmin.com">
      <text>Garmin International</text>
    </link>
    <time>2009-10-17T22:58:43Z</time>
  </metadata>
  <trk>
    <name>Example GPX Document</name>
    <trkseg>
      <trkpt lat="47.644548" lon="-122.326897">
        <ele>4.46</ele>
        <time>2009-10-17T18:37:26Z</time>
      </trkpt>
      <trkpt lat="47.644548" lon="-122.326897">
        <ele>4.94</ele>
        <time>2009-10-17T18:37:31Z</time>
      </trkpt>
      <trkpt lat="47.644548" lon="-122.326897">
        <ele>6.87</ele>
        <time>2009-10-17T18:37:34Z</time>
      </trkpt>
    </trkseg>
  </trk>
</gpx>
This file describes a track via the <trk> tag, which in turn contains track segments <trkseg>, grouped parts making up a track._
Track segments then contain the most important tags, the track points <trkpt>, which hold all the useful information like our current position, via the lat and lon attributes, the point in time this track point was recorded and any other information the device is capable of recording, like elevation and heart rate.
To work with this data we have two options:
- Parse the GPX file with an XML parser
- Use an existing GPX parser
In this example we will go with option two and use gpxparser. However, any other library that parses GPX files and parsing the file with a general XML parser would work fine as well.
Using a GPX file with gpxparser is relatively simple:
var gpx = new gpxParser()
gpx.parse(OUR_GPX_CONTENT)
console.log(gpx.tracks[0].points[0].lat)
// prints "47.644548" for our example file
Now with our understand of GPX files, we still need to be able to render a map in React.
Displaying a map in React
There are many options which allow us to render a map via React. One of the most popular ones, and what we are going to use, is leaflet in combination with react-leaflet.
For brevity's sake, I won't go into too much detail on the setup of leaflet, but you can find a getting started on react-leaflet's site.
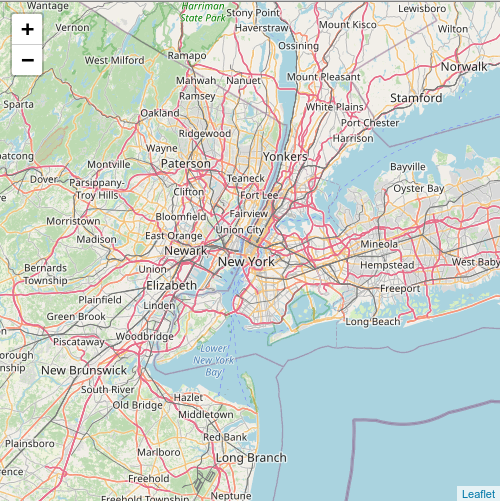
We can then simply display a map in React via the react-leaflet components. The following code snippet displays a map of New York City:
import 'leaflet/dist/leaflet.css'
import React from 'react'
import { MapContainer, Polyline, TileLayer } from 'react-leaflet'
// ...
;<MapContainer
  center={[40.7317535212683, -73.99685430908403]}
  zoom={9}
  scrollWheelZoom={false}
>
  <TileLayer url="https://{s}.tile.openstreetmap.org/{z}/{x}/{y}.png" />
</MapContainer>
// ...
There are also additional elements we can add to a leaflet map, like markers and of special importance to us, Polylines.
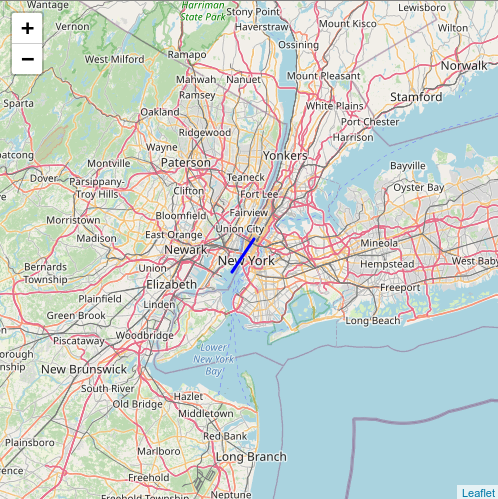
Let's see Polylines in action, by drawing a line from the statue of liberty, located at 40.689818841705, -74.04511194542516, to times square at 40.75853187779803, -73.98495720388513.
import 'leaflet/dist/leaflet.css'
import React from 'react'
import { MapContainer, Polyline, TileLayer } from 'react-leaflet'
// ...
;<MapContainer
  center={[40.7317535212683, -73.99685430908403]}
  zoom={9}
  scrollWheelZoom={false}
>
  <TileLayer url="https://{s}.tile.openstreetmap.org/{z}/{x}/{y}.png" />
  <Polyline
    pathOptions={{ fillColor: 'red', color: 'blue' }}
    positions={[
      [40.689818841705, -74.04511194542516],
      [40.75853187779803, -73.98495720388513],
    ]}
  />
</MapContainer>
// ...
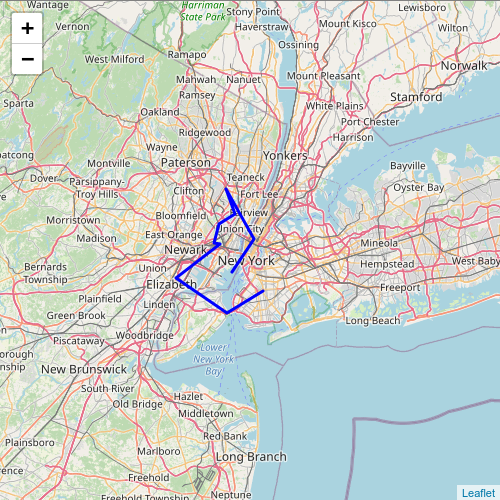
Neat! Of course our Polylines are not limited to two points, we can use any number of positions we want for a Polyline:
import 'leaflet/dist/leaflet.css'
import React from 'react'
import { MapContainer, Polyline, TileLayer } from 'react-leaflet'
// ...
return (
  <MapContainer
    center={[40.7317535212683, -73.99685430908403]}
    zoom={9}
    scrollWheelZoom={false}
  >
    <TileLayer url="https://{s}.tile.openstreetmap.org/{z}/{x}/{y}.png" />
    <Polyline
      pathOptions={{ fillColor: 'red', color: 'blue' }}
      positions={[
        [40.689818841705, -74.04511194542516],
        [40.75853187779803, -73.98495720388513],
        [40.86151538060051, -74.06201170384256],
        [40.80981015620906, -74.03656769139772],
        [40.80721155324825, -74.04274750092904],
        [40.78901848327006, -74.081199649124],
        [40.764319913561216, -74.08840942691056],
        [40.749756455072884, -74.09493255919364],
        [40.74793579843903, -74.07673645335137],
        [40.675849802727335, -74.19758606169779],
        [40.60394644123212, -74.05991363796608],
        [40.6495463256113, -73.96000671720954],
      ]}
    />
  </MapContainer>
)
I'm sure you can already guess how Polylines will be useful to display tracks from a GPX file, which is exactly what we will do now.
Putting it together to display a GPX Track
Now it's time to combine our understanding of GPX files and leaflet to render a track from a file on a map.
I'll assume that the GPX file is already parsed either before it's uploaded somewhere on the app or parsed in a node environment (which would be the server side).
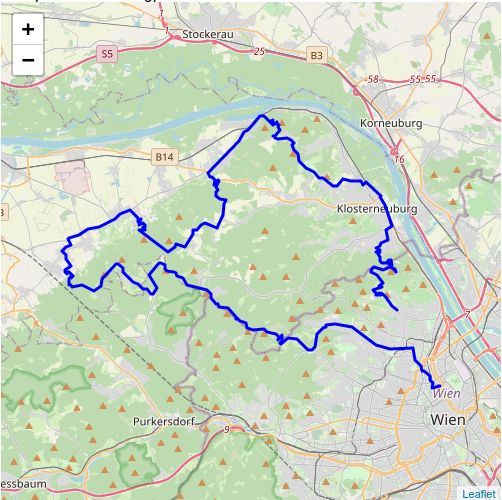
import 'leaflet/dist/leaflet.css'
import React from 'react'
import { MapContainer, Polyline, TileLayer } from 'react-leaflet'

const GpxMap = () => {
	const gpxData = /* our parsed gpx file */
	const positions = gpxData.tracks[0].points.map(p => [p.lat, p.lon]
	return (
	// ...
	<MapContainer
			// for simplicty set center to first gpx point
	        center={positions[0]}
	        zoom={9}
	        scrollWheelZoom={false}
	      >
	        <TileLayer url="https://{s}.tile.openstreetmap.org/{z}/{x}/{y}.png" />
            <Polyline
	            pathOptions={{ fillColor: 'red', color: 'blue' }}
	            positions={positions}
            />
	</MapContainer>
	// ...
	)
}
And the result is
Gotchas
There are a few things we have to keep in mind with this approach:
- We can't use server-side-rendering and the used libraries, like leaflet, will not work with SSR frameworks like next.js or gatsby. You will have to deactivate SSR for this component. There are numerous resources on the internet on how to do this, because many people already ran into this problem.
- Most of the libraries to parse GPX files do not work in a browser environment. This means that we have to either transform the GPX file during the compilation step, static rendering or on a server backend.
- While XML is a simple, human-readable format, GPX files can become especially large. If you're embedding the data of a track on a site, you should keep an eye out for the size of the data. It's typically possible to strip unneeded data and significantly reduce the data's size.
Summary
The first time I rendered a GPX file in the browser, I was pleasantly surprised by how accessible the whole process is. I hope you got some insights in how this process works with the help of this article.
Of course, there are many more complex things we could also do with GPX files on maps and I invite you to try them out with the help of the leaflet documentation!